
Installazione di Telegraf
Telegraf è un software open source di InfluxData che raccoglie metriche da servizi e sistemi (compresa la macchina su cui viene installato) per poi esporle tramite un webserver e farle utilizzare da altri servizi.


Introduzione: che cosa è Telegraf?
Telegraf è un software open source di InfluxData che raccoglie metriche da servizi e sistemi (compresa la macchina su cui viene installato) per poi esporle tramite un webserver e farle utilizzare da altri servizi.
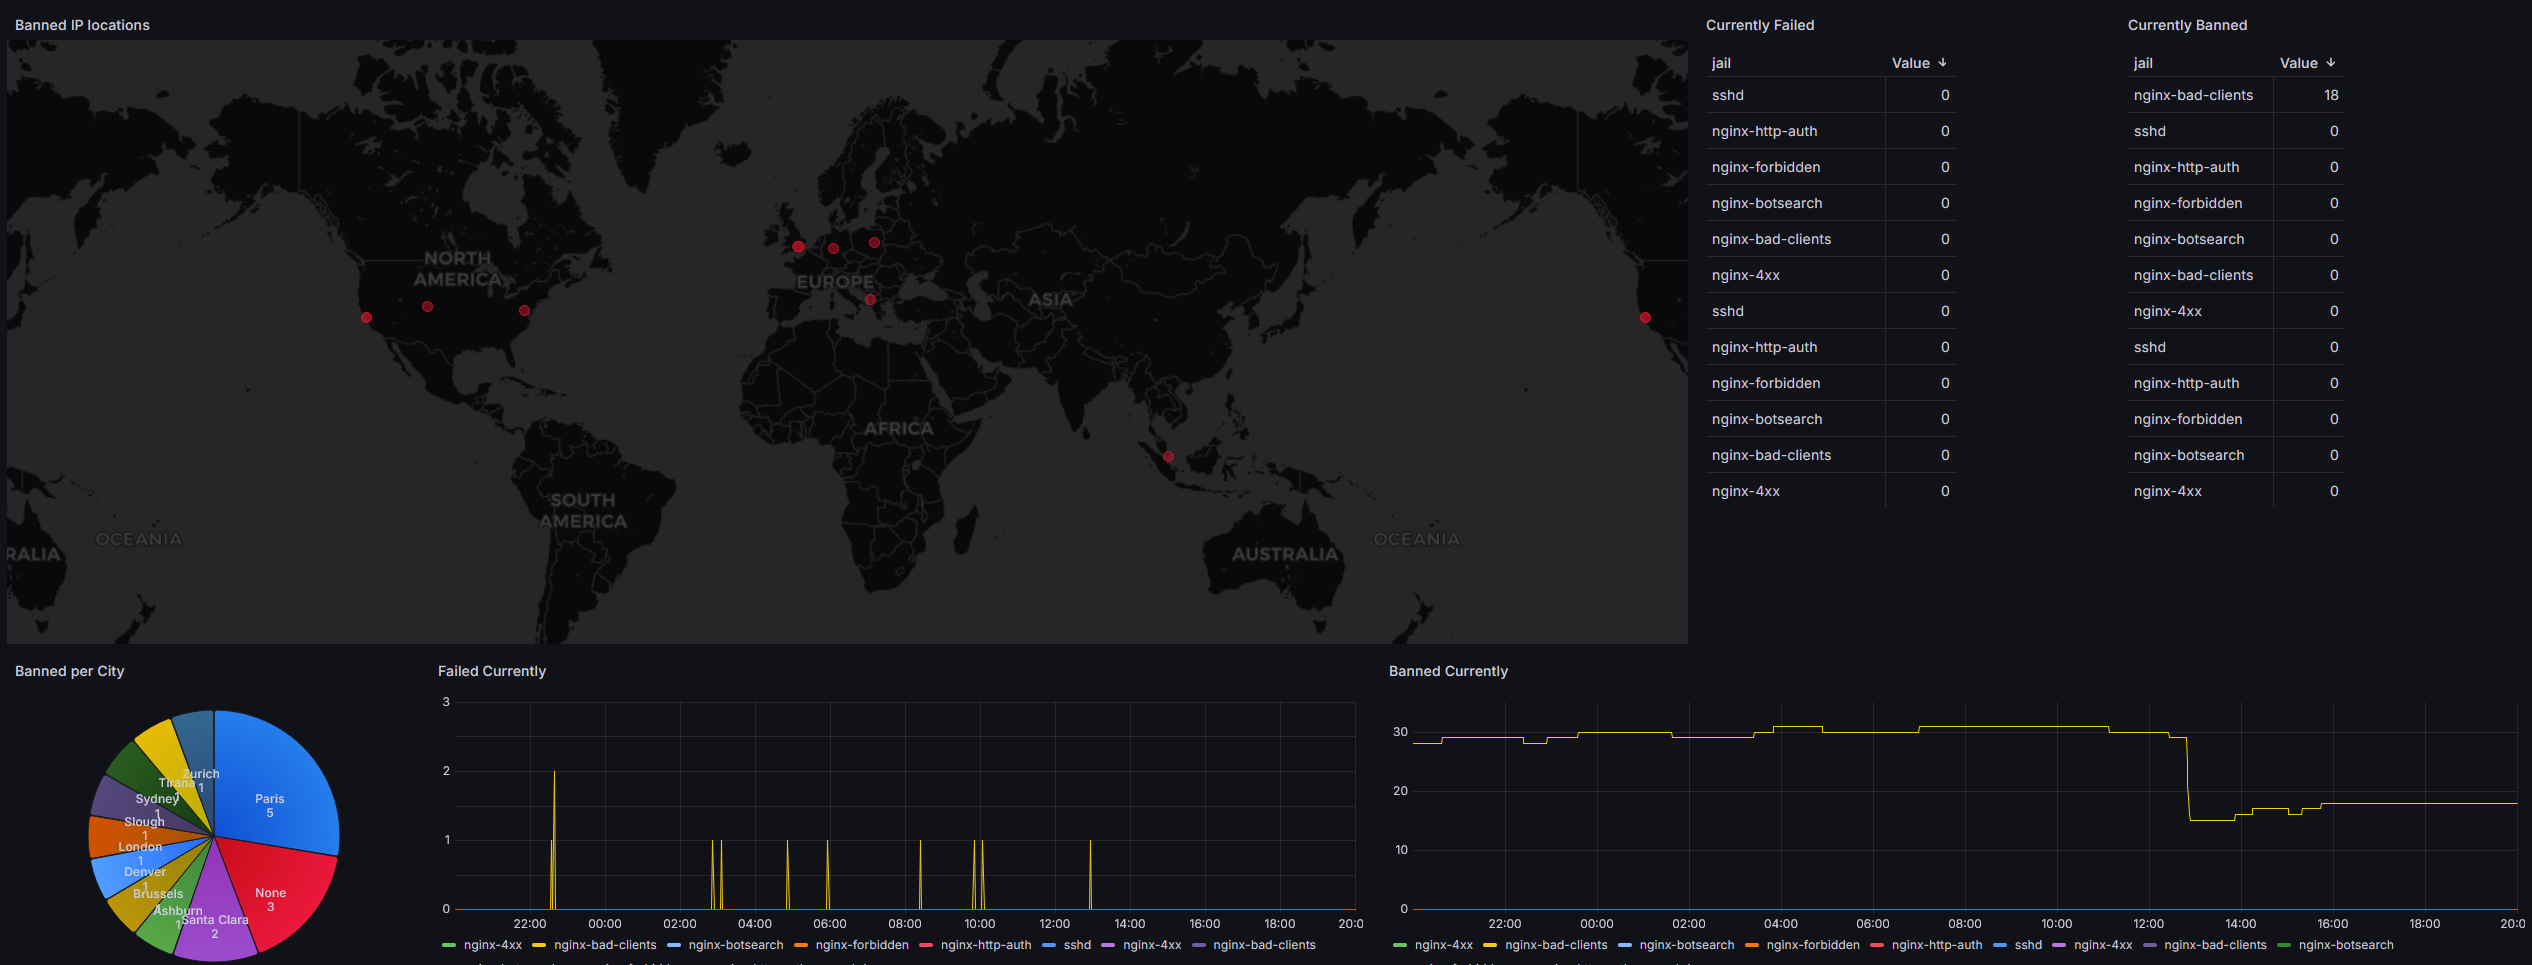
Nel mio caso, utilizzo Telegraf come agent per esporre svariate metriche a Prometheus, che le immagazzina in un Time-Series Database su cui poi Grafana effettua delle query per mostrare dashboard interattive.
Dashboard come questa, che mostra le statistiche relative agli indirizzi IP bloccati tramite Fail2Ban:
Scenario 1: Linux
(testato su Ubuntu Server 24.04)
Installare Telegraf tramite il pulsante Get Telegraf disponibile nella apposita pagina di InfluxData.
Al momento della scrittura di questo post, i comandi sono i seguenti:
curl --silent --location -O \
https://repos.influxdata.com/influxdata-archive.key \
&& echo "943666881a1b8d9b849b74caebf02d3465d6beb716510d86a39f6c8e8dac7515  influxdata-archive.key" \
| sha256sum -c - && cat influxdata-archive.key \
| gpg --dearmor \
| sudo tee /etc/apt/trusted.gpg.d/influxdata-archive.gpg > /dev/null \
&& echo 'deb [signed-by=/etc/apt/trusted.gpg.d/influxdata-archive.gpg] https://repos.influxdata.com/debian stable main' \
| sudo tee /etc/apt/sources.list.d/influxdata.list

sudo apt-get update && sudo apt-get install telegraf
Personalizzare il file di configurazione di telegraf avendo cura di abilitare -decommentandolo- almeno un output.
nano /etc/telegraf/telegraf.confIn alternativa, è possibile (e ve lo consiglio) cancellare il file di configurazione di default e crearne uno nuovo. (nell'ultimo paragrafo della guida ho inserito un file di esempio)
rm /etc/telegraf/telegraf.conf
nano /etc/telegraf/telegraf.conf
Scenario 2: Windows
(testato su Windows 11 23H2)
Ottenere il comando per scaricare il file di installazione dalla pagina Downloads scorrendo fino alla voce Telegraf e selezionando Windows Binaries (64bit)
Aprire PowerShell con diritti da amministratore
Spostarsi in C:\
cd C:\Incollare la prima riga del comando (quella con wget) ottenuto al punto precedente, poi eseguirlo
Eseguire il seguente comando per estrarre l'archivio compresso in C:\Program Files\telegraf
Expand-Archive .\telegraf-1.34.4_windows_amd64.zip -DestinationPath 'C:\Program Files\'Rinominare la cartella C:\Program Files\telegraf-xxx in C:\Program Files\telegraf
All'interno della cartella appena rinominata, modificare il file telegraf.conf attivando input ed output a piacimento (ci deve essere almeno un output)
Avviare il file telegraf.exe per avviare Telegraf e testare la configurazione
Sempre su PowerShell come amministratore eseguire il seguente comando per installare Telegraf come servizio di Windows.
C:\"Program Files"\telegraf\telegraf.exe --service installAvviare manualmente il servizio la prima volta, da services.msc
Come funziona il file telegraf.conf
Il file di configurazione di telegraf che viene creato durante la prima installazione è molto semplice da leggere, ma lunghissimo ed impossibile da navigare.
Questo perchè il file di configurazione di default comprende quasi tutte le funzioni di Telegraf, ovviamente disabilitate.
Per questo, nei passaggi precedenti, ho consigliato di cancellare il file di default e crearne direttamente uno nuovo con solamente le funzioni che servono al vostro utilizzo.
Ad ogni modo, il file di configurazione può essere spiegato in sezioni:
Sezione 1: l'agent
In cima al file è presente una sezione [agent] con vari parametri che vanno ad indicare all'agent di Telegraf cose come ogni quanto raccogliere le metriche (parametro interval).
Le impostazioni indicate in questa sezione si ripercuotono sulla frequenza e la modalità in cui tutti i sensori vengono interrogati.
Se state quindi installando Telegraf per monitorare un ambiente per cui vi serve la massima granularità, quindi, diminuite l'intervallo. Altrimenti, se spesso le metriche che raccogliete non cambiano nel giro di pochi secondi, potete indicare tempistiche più larghe come "1m" o "30m"
Sezione 2: gli inputs
Gli inputs sono una serie di plugin (riconoscibili dalle doppie parentesi quadre e dal prefisso "inputs.", per esempio [[inputs.cpu]]) che se abilitati dicono a Telegraf quali metriche raccogliere.
Di default, Telegraf ha abilitato alcune metriche relative alla macchina su cui è installato, come la CPU, l'IO e l'utilizzo dei dischi, e la RAM.
I plugin di Telegraf non servono per forza a raccogliere metriche relative alla macchina su cui viene eseguito, infatti molti plugin -tramite accurata configurazione- possono raccogliere metriche relative a endpoint SNMP, dispositivi Unifi e molto altro.
Sezione 3: gli outputs
Gli outputs sono plugin (in modo simile a quelli di input, riconoscibili dalle doppie parentesi quadre e dal prefisso "outputs.", come [[outputs.prometheus_client]]) che quando abilitati dicono a Telegraf in quale modo esporre le metriche che ha raccolto.
Si possono attivare più outputs, per esempio se si sta usando sia Prometheus che InfluxDB per raccogliere le metriche, ma perchè Telegraf funzioni deve avere almeno un output attivo (altrimenti si rifiuta di avviarsi!).
Template basico di Telegraf
Il template sottostante abilita il monitoraggio delle metriche base della macchina:
- Processore
- RAM
- Rete
- Dischi (I/O e Utilizzo Spazio)
E lo espone per l'utilizzo tramite Prometheus sulla porta 9273.
Ho comunque lasciato commenti ed opzioni commentate come da file di default, in modo da poter abilitare -volendo- altre opzioni solitamente non utilizzate.
# Configuration for telegraf agent
[agent]
  ## Default data collection interval for all inputs
  interval = "10s"
  ## Rounds collection interval to 'interval'
  ## ie, if interval="10s" then always collect on :00, :10, :20, etc.
  round_interval = true

  ## Telegraf will send metrics to outputs in batches of at most
  ## metric_batch_size metrics.
  ## This controls the size of writes that Telegraf sends to output plugins.
  metric_batch_size = 1000

  ## Maximum number of unwritten metrics per output.  Increasing this value
  ## allows for longer periods of output downtime without dropping metrics at the
  ## cost of higher maximum memory usage.
  metric_buffer_limit = 10000

  ## Collection jitter is used to jitter the collection by a random amount.
  ## Each plugin will sleep for a random time within jitter before collecting.
  ## This can be used to avoid many plugins querying things like sysfs at the
  ## same time, which can have a measurable effect on the system.
  collection_jitter = "0s"

  ## Collection offset is used to shift the collection by the given amount.
  ## This can be be used to avoid many plugins querying constraint devices
  ## at the same time by manually scheduling them in time.
  # collection_offset = "0s"

  ## Default flushing interval for all outputs. Maximum flush_interval will be
  ## flush_interval + flush_jitter
  flush_interval = "10s"
  ## Jitter the flush interval by a random amount. This is primarily to avoid
  ## large write spikes for users running a large number of telegraf instances.
  ## ie, a jitter of 5s and interval 10s means flushes will happen every 10-15s
  flush_jitter = "0s"

  ## Collected metrics are rounded to the precision specified. Precision is
  ## specified as an interval with an integer + unit (e.g. 0s, 10ms, 2us, 4s).
  ## Valid time units are "ns", "us" (or "µs"), "ms", "s".
  ##
  ## By default or when set to "0s", precision will be set to the same
  ## timestamp order as the collection interval, with the maximum being 1s:
  ##   ie, when interval = "10s", precision will be "1s"
  ##       when interval = "250ms", precision will be "1ms"
  ##
  ## Precision will NOT be used for service inputs. It is up to each individual
  ## service input to set the timestamp at the appropriate precision.
  precision = "0s"

  ## Log at debug level.
  # debug = false
  ## Log only error level messages.
  # quiet = false

  ## Log format controls the way messages are logged and can be one of "text",
  ## "structured" or, on Windows, "eventlog".
  # logformat = "text"

  ## Message key for structured logs, to override the default of "msg".
  ## Ignored if `logformat` is not "structured".
  # structured_log_message_key = "message"

  ## Name of the file to be logged to or stderr if unset or empty. This
  ## setting is ignored for the "eventlog" format.
  # logfile = ""

  ## The logfile will be rotated after the time interval specified.  When set
  ## to 0 no time based rotation is performed.  Logs are rotated only when
  ## written to, if there is no log activity rotation may be delayed.
  # logfile_rotation_interval = "0h"

  ## The logfile will be rotated when it becomes larger than the specified
  ## size.  When set to 0 no size based rotation is performed.
  # logfile_rotation_max_size = "0MB"

  ## Maximum number of rotated archives to keep, any older logs are deleted.
  ## If set to -1, no archives are removed.
  # logfile_rotation_max_archives = 5

  ## Pick a timezone to use when logging or type 'local' for local time.
  ## Example: America/Chicago
  # log_with_timezone = ""

  ## Override default hostname, if empty use os.Hostname()
  # hostname = ""
  ## If set to true, do no set the "host" tag in the telegraf agent.
  # omit_hostname = false

  ## Method of translating SNMP objects. Can be "netsnmp" (deprecated) which
  ## translates by calling external programs snmptranslate and snmptable,
  ## or "gosmi" which translates using the built-in gosmi library.
  # snmp_translator = "netsnmp"

  ## Name of the file to load the state of plugins from and store the state to.
  ## If uncommented and not empty, this file will be used to save the state of
  ## stateful plugins on termination of Telegraf. If the file exists on start,
  ## the state in the file will be restored for the plugins.
  # statefile = ""

  ## Flag to skip running processors after aggregators
  ## By default, processors are run a second time after aggregators. Changing
  ## this setting to true will skip the second run of processors.
  # skip_processors_after_aggregators = false

###############################################################################
#                            INPUT PLUGINS                                    #
###############################################################################
# Read metrics about cpu usage
[[inputs.cpu]]
  ## Whether to report per-cpu stats or not
  percpu = false
  ## Whether to report total system cpu stats or not
  totalcpu = true
  ## If true, collect raw CPU time metrics
  collect_cpu_time = false
  ## If true, compute and report the sum of all non-idle CPU states
  ## NOTE: The resulting 'time_active' field INCLUDES 'iowait'!
  report_active = true
  ## If true and the info is available then add core_id and physical_id tags
  core_tags = false

# Read metrics about disk usage by mount point
[[inputs.disk]]
  ## By default stats will be gathered for all mount points.
  ## Set mount_points will restrict the stats to only the specified mount points.
  # mount_points = ["/"]

  ## Ignore mount points by filesystem type.
  ignore_fs = ["tmpfs", "devtmpfs", "devfs", "iso9660", "overlay", "aufs", "squashfs"]

  ## Ignore mount points by mount options.
  ## The 'mount' command reports options of all mounts in parathesis.
  ## Bind mounts can be ignored with the special 'bind' option.
  # ignore_mount_opts = []

# Read metrics about disk IO by device
[[inputs.diskio]]
  ## Devices to collect stats for
  ## Wildcards are supported except for disk synonyms like '/dev/disk/by-id'.
  ## ex. devices = ["sda", "sdb", "vd*", "/dev/disk/by-id/nvme-eui.00123deadc0de123"]
  # devices = ["*"]
  ## Skip gathering of the disk's serial numbers.
  # skip_serial_number = true
  ## Device metadata tags to add on systems supporting it (Linux only)
  ## Use 'udevadm info -q property -n <device>' to get a list of properties.
  ## Note: Most, but not all, udev properties can be accessed this way. Properties
  ## that are currently inaccessible include DEVTYPE, DEVNAME, and DEVPATH.
  # device_tags = ["ID_FS_TYPE", "ID_FS_USAGE"]
  ## Using the same metadata source as device_tags, you can also customize the
  ## name of the device via templates.
  ## The 'name_templates' parameter is a list of templates to try and apply to
  ## the device. The template may contain variables in the form of '$PROPERTY' or
  ## '${PROPERTY}'. The first template which does not contain any variables not
  ## present for the device is used as the device name tag.
  ## The typical use case is for LVM volumes, to get the VG/LV name instead of
  ## the near-meaningless DM-0 name.
  # name_templates = ["$ID_FS_LABEL","$DM_VG_NAME/$DM_LV_NAME"]


# Plugin to collect various Linux kernel statistics.
# This plugin ONLY supports Linux
[[inputs.kernel]]
  ## Additional gather options
  ## Possible options include:
  ## * ksm - kernel same-page merging
  ## * psi - pressure stall information
  # collect = []

# Read metrics about memory usage
[[inputs.mem]]
  # no configuration

# Get the number of processes and group them by status
# This plugin ONLY supports non-Windows
[[inputs.processes]]
  ## Use sudo to run ps command on *BSD systems. Linux systems will read
  ## /proc, so this does not apply there.
  # use_sudo = false

# Read metrics about swap memory usage
[[inputs.swap]]
  # no configuration

# Read metrics about system load & uptime
[[inputs.system]]
  # no configuration


[[inputs.net]]

###############################################################################
#                           OUTPUT PLUGINS                                    #
###############################################################################

# Configuration for the Prometheus client to spawn
[[outputs.prometheus_client]]
  ## Address to listen on.
  ##   ex:
  ##     listen = ":9273"
  ##     listen = "vsock://:9273"
  listen = ":9273"

  ## Maximum duration before timing out read of the request
  # read_timeout = "10s"
  ## Maximum duration before timing out write of the response
  # write_timeout = "10s"

  ## Metric version controls the mapping from Prometheus metrics into Telegraf metrics.
  ## See "Metric Format Configuration" in plugins/inputs/prometheus/README.md for details.
  ## Valid options: 1, 2
  # metric_version = 1

  ## Use HTTP Basic Authentication.
  # basic_username = "Foo"
  # basic_password = "Bar"

  ## If set, the IP Ranges which are allowed to access metrics.
  ##   ex: ip_range = ["192.168.0.0/24", "192.168.1.0/30"]
  # ip_range = []

  ## Path to publish the metrics on.
  # path = "/metrics"

  ## Expiration interval for each metric. 0 == no expiration
  # expiration_interval = "60s"

  ## Collectors to enable, valid entries are "gocollector" and "process".
  ## If unset, both are enabled.
  # collectors_exclude = ["gocollector", "process"]

  ## Send string metrics as Prometheus labels.
  ## Unless set to false all string metrics will be sent as labels.
  # string_as_label = true

  ## If set, enable TLS with the given certificate.
  # tls_cert = "/etc/ssl/telegraf.crt"
  # tls_key = "/etc/ssl/telegraf.key"

  ## Set one or more allowed client CA certificate file names to
  ## enable mutually authenticated TLS connections
  # tls_allowed_cacerts = ["/etc/telegraf/clientca.pem"]

  ## Export metric collection time.
  # export_timestamp = false

  ## Specify the metric type explicitly.
  ## This overrides the metric-type of the Telegraf metric. Globbing is allowed.
  # [outputs.prometheus_client.metric_types]
  #   counter = []
  #   gauge = []
Come provo se Telegraf funziona?
Se non hai ancora installato un sistema che legga le informazioni da Telegraf, puoi attivare l'output di Prometheus ed andare, tramite un browser, all'endpoint che Telegraf inizierà ad esporre:
http://indirizzo.IP.di.Telegraf:9273
Dovresti quindi ricevere in risposta una pagina in plaintext simile a questa
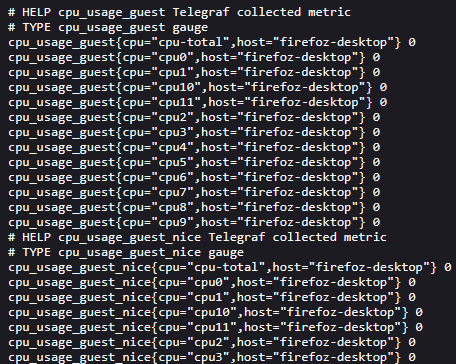
Queste sono le metriche che poi Prometheus (o qualsiasi sistema di raccolta delle metriche che utilizzerai) andrà a leggere.